High-Impact Economic Events Every Trader Should Watch
Why markets react to surprises—not headlines. A complete guide to rate decisions, CPI, NFP, GDP, PMI, and how pros read the economic calendar.

Table of contents
- Markets Don't React to News. They React to Surprises.
- Scenario One — No Surprise
- Scenario Two — Big Surprise
- How Economic Information Travels Through Financial Markets
- Why Central Banks Matter More Than Anyone Else
- Not Every High-Impact Event Moves Markets for the Same Reason
- 1. Interest Rate Decisions — The Most Influential Event on the Calendar
- Why Do Interest Rates Matter So Much?
- How One Rate Decision Ripples Across Every Market
- The Decision Is Only Half the Story
- Which Markets React the Most?
- A Real-World Example
- Key Takeaways — Rates
- Looking for real-time high-impact event data?
- 2. Inflation Reports (CPI): The Number That Can Move Every Major Market
- What Exactly Is Inflation?
- How Is Inflation Measured?
- Headline CPI vs Core CPI
- Markets Care About the Surprise — Not the Number
- A Real Trading Day
- Common Mistakes on CPI Day
- Key Takeaways — CPI
- 3. Employment Reports: Why the Labor Market Moves Every Asset Class
- Why Central Banks Care So Much About Employment
- Non-Farm Payrolls (NFP)
- How Different Markets Interpret NFP
- Why Good Employment News Can Hurt Stocks
- A Realistic Scenario
- Common Mistakes on NFP Day
- Key Takeaways — Employment
- 4. Measuring the Economy: GDP, PMI, Retail Sales & More
- GDP — The Economy's Report Card
- Retail Sales — Following the Consumer
- PMI — Looking Into the Future
- Consumer Confidence & Industrial Production
- Looking at the Economy Like a Puzzle
- Key Takeaways — Growth Indicators
- 5. Putting Everything Together: How Pros Read the Calendar
- Why Good News Can Sometimes Crash the Market
- Every Report Answers One Big Question
- How Professionals Prepare Before High-Impact Events
- A Practical 5-Step Framework
- The Most Common Mistakes Traders Make
- Building a Daily Economic Calendar Routine
- Want high-impact events inside your product — live?
- The Economic Calendar Is More Than a Schedule
- Final Thoughts
Every trader remembers a day when the market behaved in a way that seemed impossible.
Perhaps EUR/USD moved more than one hundred pips within minutes. Gold suddenly dropped thirty dollars despite looking technically strong. Or maybe the S&P 500 erased an entire day's gains in less than an hour.
For inexperienced traders, these moments often feel random. Some blame algorithms. Others talk about market manipulation or "smart money."
In reality, the explanation is usually much simpler.
Not all information, however, carries the same weight.
Every day, governments, central banks, and statistical agencies publish dozens of economic reports. Some barely attract attention. Others immediately reshape expectations about inflation, interest rates, economic growth, and corporate profits. When that happens, prices across multiple asset classes can move almost instantly.
This raises an important question.
Why do certain economic events trigger enormous market reactions while others are almost completely ignored?
The answer lies at the heart of macroeconomics: financial markets are not trying to describe today's economy. They are constantly trying to estimate tomorrow's economy.
Once you understand this principle, economic calendars stop looking like long lists of dates and numbers. Instead, they become a map of the information that drives global financial markets.
By the end of this guide, you won't simply recognize the names of important reports. You'll understand why professional traders monitor them, how different reports fit together, and why the market sometimes reacts in ways that appear completely irrational to everyone else.
Markets Don't React to News. They React to Surprises.
One of the biggest misconceptions among new traders is the belief that markets move because good news is released or bad news is announced.
If that were true, predicting market reactions would be easy. Strong data would always push prices higher. Weak data would always push prices lower.
Anyone who has traded for more than a few months knows that reality is very different.
Sometimes excellent employment numbers send stock markets lower. Sometimes weak GDP data strengthens a currency. Sometimes inflation rises sharply and gold falls instead of rising.
These reactions seem contradictory until you understand one simple concept:
Imagine that economists around the world expect U.S. inflation to be 3.0%. Weeks before the official CPI report is released, investment banks, hedge funds, asset managers, and algorithmic trading systems have already incorporated that expectation into their decisions.
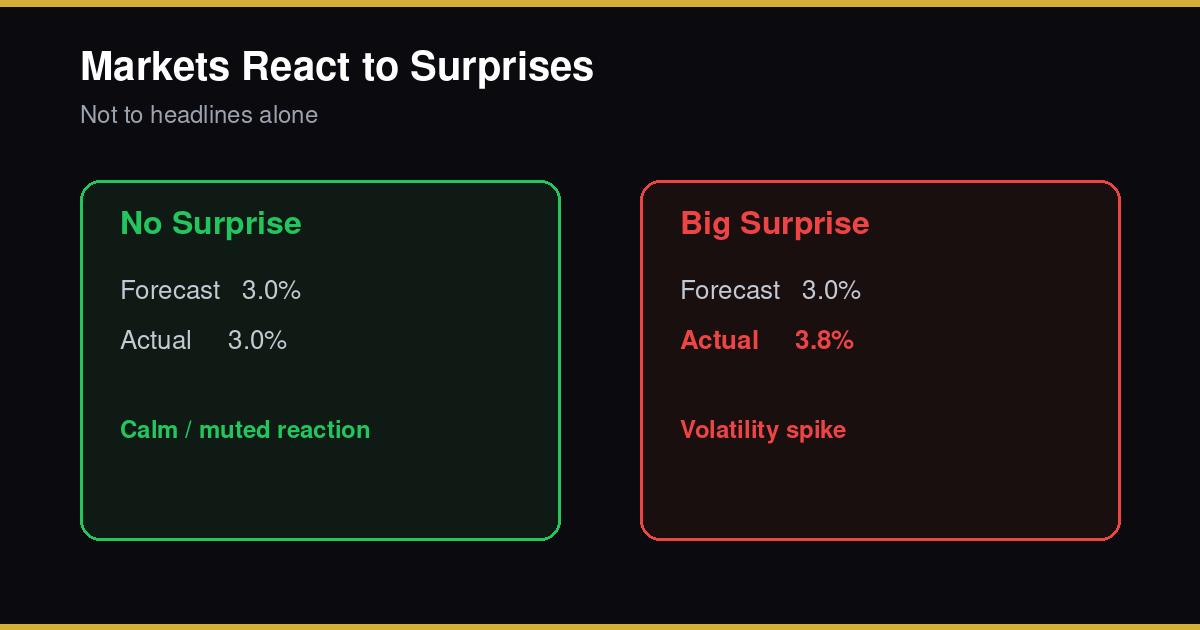
Scenario One — No Surprise
| Expected inflation | 3.0% |
| Actual inflation | 3.0% |
Nothing surprising happened. The report confirmed what investors already believed. Prices may move briefly because of short-term trading activity, but there is little reason for investors to completely change their outlook.
Scenario Two — Big Surprise
| Expected inflation | 3.0% |
| Actual inflation | 3.8% |
Suddenly, everything changes.
Higher inflation may force the Federal Reserve to keep interest rates elevated for longer than previously expected. Higher interest rates affect bond yields. Bond yields influence currency valuations. Currency movements affect multinational companies. Changes in borrowing costs alter corporate profits.
Within seconds, investors around the world begin updating their expectations.
Notice something important: nothing in the real economy changed during those few seconds. Factories didn't suddenly become more productive. Consumers didn't instantly change their spending habits. Employment didn't double overnight.
Only one thing changed.
Investors' expectations about the future.
That single adjustment is often enough to move trillions of dollars across financial markets.
The surprise principle
Always compare Actual vs Forecast. The headline number alone tells half the story. The gap between expectation and reality is what moves price.
How Economic Information Travels Through Financial Markets
To understand why certain reports are considered "high impact," it helps to think of economic information as moving through a chain of decisions rather than affecting markets directly.
A single economic report rarely changes prices by itself. Instead, it changes expectations — and those expectations influence how investors value different assets.
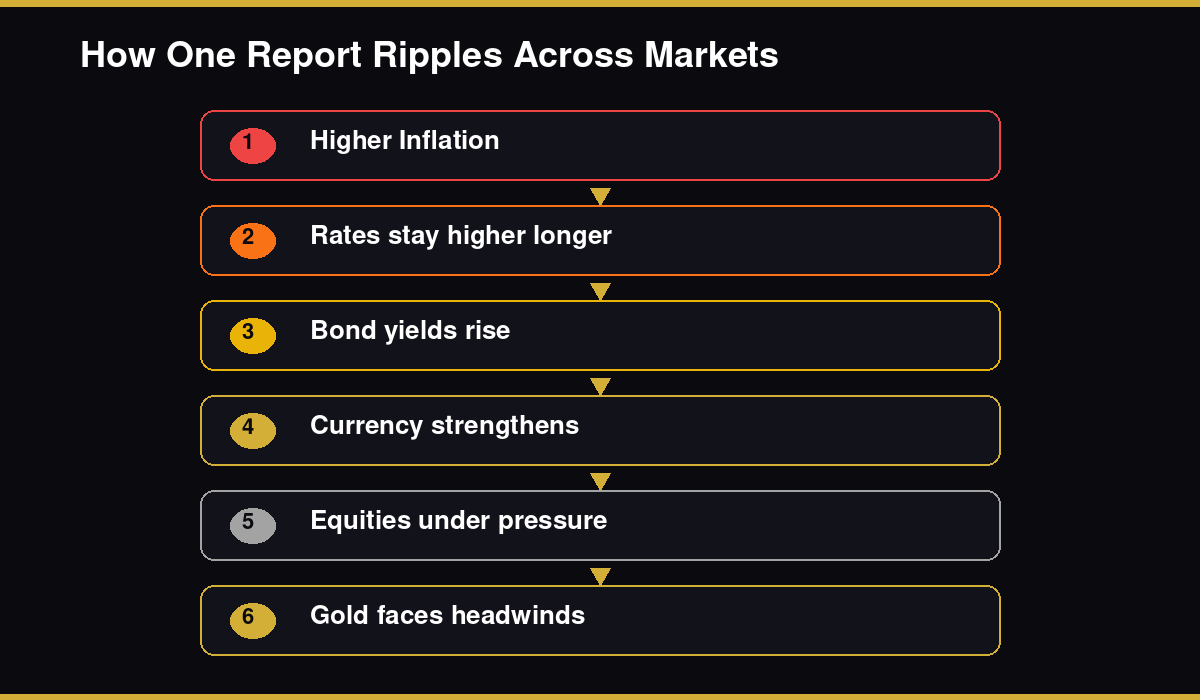
Consider an inflation report that comes in much higher than economists expected. Investors begin considering a sequence like this:
- Higher inflation — consumers are paying more for goods and services
- The central bank becomes more concerned about inflation
- Interest rates may remain higher for longer
- Government bond yields increase
- The domestic currency becomes more attractive
- Higher borrowing costs reduce the present value of future corporate earnings
- Some equity sectors come under pressure
- Gold may weaken as real yields rise
This is why experienced traders rarely ask "What happened?"
Instead, they ask:
That question lies at the center of professional macroeconomic analysis.
Why Central Banks Matter More Than Anyone Else
Almost every high-impact economic event has one thing in common: it influences the decisions of central banks.
Whether the report measures inflation, employment, consumer spending, manufacturing activity, or economic growth, traders eventually interpret it through one lens:
How will policymakers respond?
Central banks sit at the center of modern financial markets because they control short-term interest rates. Those interest rates influence almost every major asset class:
- They affect the attractiveness of one currency relative to another
- They influence mortgage rates and business loans
- They change government bond yields
- They alter company valuations
- They influence investor appetite for risk
- They even affect cryptocurrency markets through changes in global liquidity
You can think of every major economic release as another piece of evidence presented to the central bank. One report rarely changes policy on its own. But several reports pointing in the same direction gradually reshape expectations.
Not Every High-Impact Event Moves Markets for the Same Reason
Although traders often group important announcements under the label "high-impact events," they don't all answer the same economic question.
Each report reveals something different about the health of the economy. Understanding these differences is much more useful than memorizing release dates.
Broadly speaking, high-impact events fall into five categories.
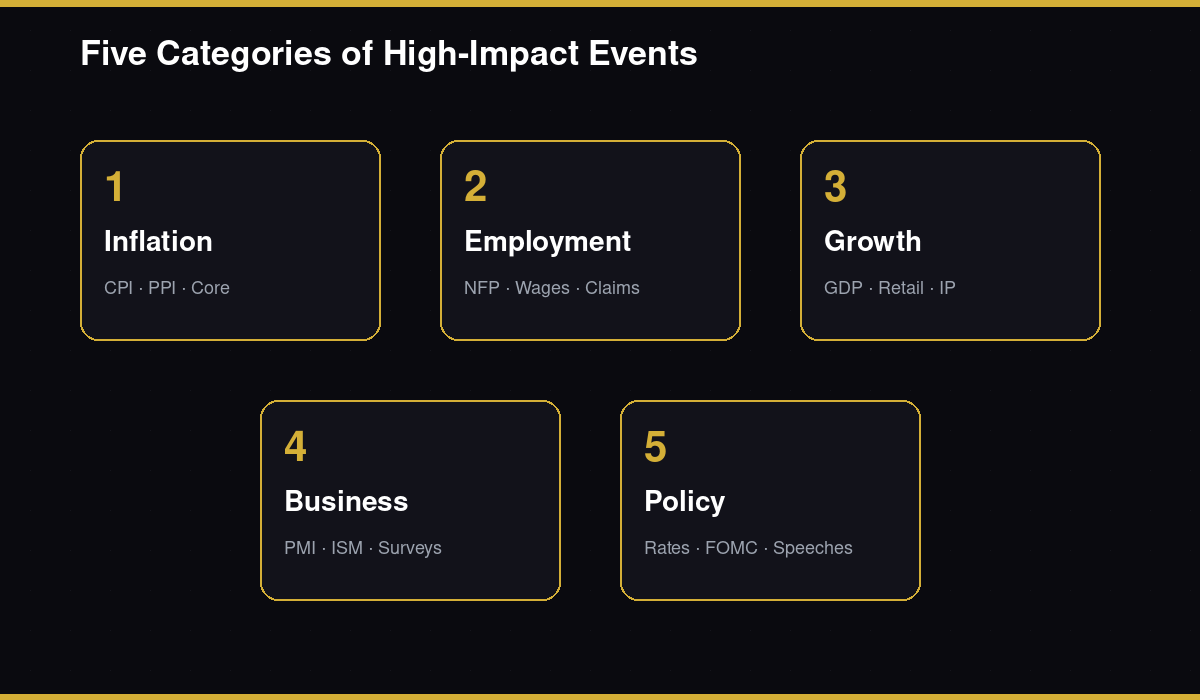
Are prices rising too fast?
CPI, PPI, Core Inflation — the reports that shape rate expectations most directly.
How strong is the labor market?
NFP, Unemployment Rate, Average Hourly Earnings, Jobless Claims.
Is the economy expanding?
GDP, Retail Sales, Industrial Production, Durable Goods Orders.
Where are we heading?
Manufacturing PMI, Services PMI, ISM, Business Confidence — often leading indicators.
What will the central bank do?
Rate decisions, FOMC statements, ECB press conferences, minutes, and governor speeches.
One of the fastest ways to improve as a trader is to stop viewing economic reports as isolated events. Professional investors rarely interpret a CPI report without considering employment data. They don't analyze GDP without looking at consumer spending. They don't evaluate central bank decisions without understanding inflation.
Learning to connect these reports is one of the biggest differences between simply following an economic calendar and truly understanding it.
In the sections below, we examine each major high-impact event individually — answering four practical questions for every indicator:
- What exactly does it measure?
- Why do financial markets care about it?
- Which asset classes usually react the most?
- How should traders interpret stronger-than-expected and weaker-than-expected results?
1. Interest Rate Decisions — The Most Influential Event on the Calendar
If someone asked experienced macro traders to identify the single most important scheduled event on the economic calendar, many would give the same answer:
Almost every major economic report — whether it measures inflation, employment, consumer spending, or manufacturing activity — is ultimately judged by one question:
Will this change the central bank's interest rate path?
Why Do Interest Rates Matter So Much?
At first glance, an increase from 4.50% to 4.75% may appear insignificant. For households, the difference may seem small. For financial markets, however, that quarter-point increase changes the price of money itself.
When central banks increase interest rates:
- Borrowing becomes more expensive
- Businesses face higher financing costs
- Consumers pay more for mortgages, car loans, and credit cards
- Investment projects become less attractive
- Economic growth often slows
When central banks reduce interest rates, the opposite tends to occur — credit becomes cheaper, consumers spend more, businesses invest more aggressively, and economic activity usually accelerates.
How One Rate Decision Ripples Across Every Market
Imagine that the Federal Reserve unexpectedly raises interest rates. A simplified chain reaction might look like this:
Borrowing becomes more expensive
Banks increase lending rates. Businesses reconsider expansion. Consumers postpone major purchases. Demand gradually weakens.
Government bond yields rise
Newly issued bonds offer more attractive returns. Investors reallocate capital toward fixed-income assets.
The domestic currency strengthens
International investors search for higher returns. Capital flows toward dollar-denominated assets — often strengthening the USD.
Equity valuations come under pressure
Higher rates reduce the present value of future earnings. Growth and tech stocks are often particularly sensitive.
Gold faces headwinds
Gold generates no interest income. When real yields rise, holding gold becomes relatively less attractive.
The Decision Is Only Half the Story
One of the biggest surprises for beginner traders is discovering that markets sometimes barely react after an interest rate announcement — because the decision itself is often already expected.
When the expected decision finally arrives, there is little new information. The real market-moving event often begins a few minutes later — during the press conference.
Consider these two statements:
"Inflation has made encouraging progress."
"Inflation remains unacceptably high."
The interest rate may remain exactly the same. Yet the second statement suggests policymakers are still worried about inflation and may hesitate to cut rates. Markets immediately begin adjusting expectations.
Sometimes a single sentence spoken during a press conference produces larger market moves than the policy decision itself.
Forward guidance matters more than today
Instead of asking "What did the central bank do today?", professionals ask "What is the central bank likely to do over the next six months?" That is forward guidance — and it frequently explains moves that confuse beginners.
Which Markets React the Most?
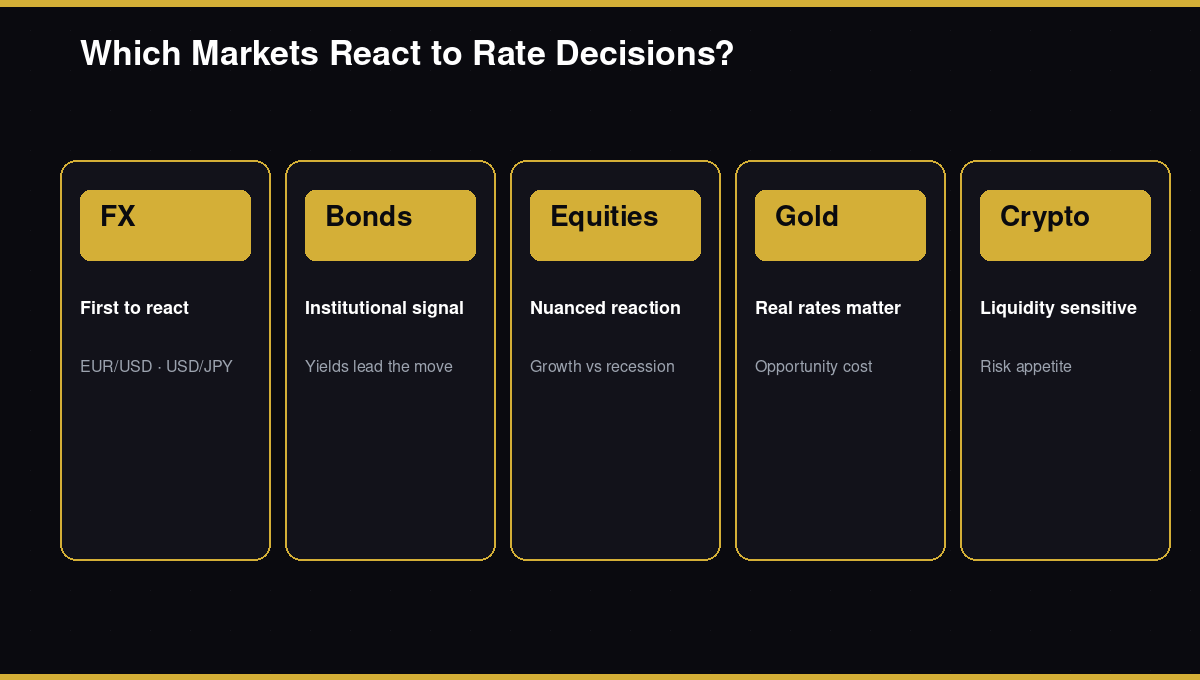
Usually first
Rate expectations change how attractive one currency is versus another — watch EUR/USD, USD/JPY, GBP/USD.
Institutional signal
Pros often watch yields before currencies or equities for how seriously investors interpret the message.
Nuanced
Higher rates can slow growth and valuations — or markets may rally if inflation looks controlled without a recession.
Real rates
Watch real interest rates, inflation expectations, and the dollar — not just the headline policy rate.
Liquidity
Aggressive tightening has often coincided with weaker performance across speculative assets, including crypto.
A Real-World Example
The market overwhelmingly expects the Fed to begin cutting rates in September. Investors have priced in two cuts before year-end. At the next meeting, the Fed leaves rates unchanged — as expected. Markets barely move.
Then the Chair explains that recent inflation data has been stronger than anticipated and that policymakers are prepared to keep rates elevated for longer if necessary.
Within minutes: Treasury yields rise, the U.S. dollar strengthens, gold declines, growth stocks come under pressure, and rate-sensitive sectors such as real estate weaken.
What changed? Not today's interest rate.
The market's expectations about future interest rates.
Key Takeaways — Rates
- Interest rate decisions influence virtually every major financial market
- Expectations matter far more than the decision itself
- Professional traders spend as much time interpreting central bank communication as they do analyzing economic data
Once you understand interest rates, every other high-impact economic event begins to make much more sense — because inflation is often the force that drives those decisions.
Looking for real-time high-impact event data?
If you build a Forex platform, fintech dashboard, or trading tool, you don’t need to scrape websites. EconPulse delivers live macroeconomic events — with Actual, Forecast, Previous, impact levels, and multilingual titles — through a clean JSON API.
- Filter by
importance=high - Rate decisions, CPI, NFP & more
- Up to 23 languages
- Ready for brokers & algos
2. Inflation Reports (CPI): The Number That Can Move Every Major Market
If interest rate decisions sit at the center of financial markets, inflation is often the force that shapes those decisions.
Every month, millions of investors pause for a few moments before the latest Consumer Price Index (CPI) is released. Then, at the exact release time, markets often erupt — currencies move sharply, gold can gain or lose tens of dollars, bond yields jump, and stock index futures change direction almost instantly.
What Exactly Is Inflation?
Inflation is not about the price of one product becoming more expensive. It is about the general increase in prices across an economy over time.
If housing, transportation, healthcare, food, education, clothing, and dozens of other categories all become more expensive over time, the economy is experiencing inflation. That reduces purchasing power — the same amount of money buys fewer goods and services than it did before.
For central banks, persistent inflation is one of the biggest policy challenges. For financial markets, inflation influences almost every asset class.
How Is Inflation Measured?
Statistical agencies estimate inflation by tracking the prices of hundreds — or sometimes thousands — of goods and services purchased by households. These products form a basket of goods and services. The percentage change in the cost of that basket becomes the Consumer Price Index (CPI).
Headline CPI vs Core CPI
Everything included
Food, energy, housing, healthcare, transportation — the full cost-of-living picture. More volatile due to temporary shocks.
Food & energy removed
Helps identify longer-term inflation trends. Markets often react as strongly — or more strongly — to Core than to Headline.
Economists aren't saying food and energy don't matter. They're trying to identify whether inflation pressures are becoming deeply embedded throughout the economy. Central banks usually avoid changing policy solely in response to temporary shocks — which is why Core CPI gets so much attention.
Markets Care About the Surprise — Not the Number
Suppose next week's CPI is expected at 2.9%. By release time, that expectation is already priced in.
| Scenario | Forecast | Actual | Likely interpretation |
|---|---|---|---|
| Matches | 2.9% | 2.9% | Confirms outlook — muted lasting trend |
| Hotter | 2.9% | 3.4% | Rates may stay higher longer — volatility |
| Cooler | 2.9% | 2.5% | Rate cuts more likely — risk appetite rises |
Good inflation news can still hurt stocks
Inflation may fall — but not as much as expected. Investors then conclude rates may stay higher for longer, and valuations adjust downward. Markets compare reality with expectations — not with yesterday.
A Real Trading Day
It is 8:30 a.m. in New York. Consensus CPI: 3.1%. The official figure: 3.8%.
Within seconds: bond yields rise, the dollar strengthens, gold drops, technology stocks fall, and Bitcoin weakens.
Did inflation itself cause all these moves? Not directly. The report changed one critical expectation: the Federal Reserve may need to keep monetary policy tighter than previously believed. Everything else followed from that single idea.
Common Mistakes on CPI Day
Trading seconds before the release
Liquidity disappears, spreads widen, execution becomes unpredictable. Entering moments before a major print is usually poor risk management — not confidence.
Looking only at the headline
Pros examine Core CPI, monthly vs annual, revisions, and the composition of price increases. Markets sometimes reverse after the full report is digested.
Ignoring market expectations
A high inflation number is meaningless without the forecast. Was it expected? Underestimated? The consensus is half the story.
Assuming the first move is the final move
Algorithms react instantly. Institutions need minutes or hours. Patience frequently produces better decisions than speed.
Key Takeaways — CPI
Inflation reports are not important because they describe yesterday's prices. They are important because they shape tomorrow's monetary policy — and therefore currencies, bonds, equities, commodities, and digital assets.
3. Employment Reports: Why the Labor Market Moves Every Asset Class
If inflation tells us how quickly prices are rising, employment data helps answer an equally important question:
How strong is the economy beneath the surface?
To investors, the labor market is not merely a measure of jobs. It is a window into consumer spending, business confidence, wage growth, inflationary pressure, and ultimately future monetary policy. Some of the most volatile trading days of the year occur when major labor market data is released.
Why Central Banks Care So Much About Employment
Rising unemployment → weaker spending → slower growth → possible rate cuts.
Aggressive hiring + low unemployment + rising wages → potential inflation pressure → possible tighter policy.
This creates one of the most fascinating realities in macroeconomics:
Non-Farm Payrolls (NFP)
Among all labor market indicators, none attracts more attention than U.S. Non-Farm Payrolls — released on the first Friday of most months.
The headline NFP figure estimates how many jobs were added or lost during the previous month (excluding farm workers and certain other categories). The larger the difference between expectations and reality, the larger the potential market reaction.
But NFP is really a collection of indicators. Professionals often spend more time on the supporting details than on the headline alone:
| Metric | What it tells you |
|---|---|
| Unemployment Rate | Share of the labor force seeking work — context matters (participation can rise too) |
| Average Hourly Earnings | Wage growth — closely linked to inflation risk |
| Labor Force Participation | How many working-age people are employed or actively seeking work |
| Revisions | Last month's figure may be adjusted — sometimes more important than today's print |
How Different Markets Interpret NFP
- Forex — Strong payrolls + wages → tighter policy expected → often supports the dollar
- Bonds — Stronger labor market may push yields higher
- Stocks — Healthy growth is positive until investors fear rates will stay higher for longer
Why Good Employment News Can Hurt Stocks
A stronger labor market may increase the probability that the central bank keeps rates elevated. Higher interest rates reduce the present value of future corporate earnings. As a result, strong economic news can occasionally create negative reactions in equity markets.
The market is forward-looking. Always.
A Realistic Scenario
| Consensus | Actual | |
|---|---|---|
| NFP | +180,000 | +340,000 |
| Unemployment | 4.1% | 3.8% |
| Wage growth | 0.3% | 0.5% |
Investors conclude: the labor market is stronger than expected, wage pressure may persist, inflation risks remain, and future rate cuts become less certain. Yields rise, the dollar strengthens, gold weakens, growth stocks face pressure.
Again: the report did not move markets directly. It changed expectations.
Common Mistakes on NFP Day
Trading purely on the headline
Check wage growth, unemployment, participation, and revisions. Details sometimes flip the entire interpretation.
Ignoring revisions
Last month's figure may be revised higher or lower. Occasionally revisions matter more than the latest print.
Assuming strong data always means a strong market
Stronger data can increase concerns about future tightening. Markets react to implications, not labels.
Chasing the first price move
Algorithms first, institutions second, policy reassessment third. These stages do not always point the same way.
Key Takeaways — Employment
A strong labor market is not automatically bullish. A weak labor market is not automatically bearish. The reaction depends on how the data changes expectations about inflation, growth, and central bank policy.
4. Measuring the Economy: GDP, PMI, Retail Sales & More
Inflation and employment dominate headlines — but they still don't tell the whole story. Investors also need to know: Are consumers still spending? Are factories receiving new orders? Are businesses expanding or becoming cautious? Is growth accelerating or slowing?
GDP — The Economy's Report Card
Gross Domestic Product measures the total value of goods and services produced within an economy over a specific period. It is the broadest measure of economic activity — yet it often produces smaller market reactions than beginners expect.
Why? Timing. GDP is usually published after employment, inflation, retail sales, industrial production, and business surveys have already been released. Markets have often already assembled most of the puzzle. GDP confirms — or occasionally challenges — that picture.
GDP becomes a major mover when the economy unexpectedly enters recession, growth accelerates far beyond expectations, the print contradicts recent reports, or investors are uncertain about future monetary policy.
Retail Sales — Following the Consumer
In many developed economies, household consumption is the largest component of GDP. Retail Sales measure how much consumers spend at stores, restaurants, online retailers, and other businesses — one of the clearest windows into consumer confidence.
Again, context decides whether "strong" sales are good or bad. If the central bank is trying to slow demand while inflation remains high, unexpectedly strong Retail Sales may imply rates stay higher for longer — and stocks may decline despite "good" news.
PMI — Looking Into the Future
Most official statistics describe what has already happened. Markets constantly price what is likely to happen next. That is why traders watch the Purchasing Managers' Index (PMI).
PMI surveys business managers about new orders, hiring, supplier delivery times, production, and inventories. Because purchasing managers notice changes early, PMI is often a leading indicator.
The 50-level rule
Above 50 generally indicates expansion. Below 50 suggests contraction. The further from 50, the stronger the signal. Manufacturing and Services PMI should be read together.
Consumer Confidence & Industrial Production
- Consumer Confidence — soft data on how households feel about jobs, income, inflation, and conditions; often an early warning before spending changes
- Industrial Production — output from factories, mines, and utilities; highly cyclical and quick to respond when demand shifts
Looking at the Economy Like a Puzzle
Beginners ask: "Which report is most important?"
Professionals ask: "How do today's reports fit together?"
Imagine this sequence over several weeks:
- CPI continues rising
- NFP beats expectations
- Retail Sales remain strong
- Manufacturing PMI climbs above 50
- Consumer Confidence improves
Each report points the same way: demand is healthy, businesses expand, inflation pressure may persist — and markets begin anticipating tighter policy before the next central bank meeting.
The opposite sequence — falling inflation, weaker employment, soft retail, PMI below 50, deteriorating confidence — describes an economy losing momentum. Investors may begin expecting rate cuts months before policymakers announce them.
Key Takeaways — Growth Indicators
| Indicator | Role |
|---|---|
| GDP | Where the economy has been |
| Retail Sales | How consumers behave today |
| PMI | Where businesses believe we are heading |
| Consumer Confidence | Expectations before spending changes |
| Industrial Production | Whether output is actually rising |
Viewed together, they create a detailed picture of economic momentum — far more valuable than any single headline.
5. Putting Everything Together: How Pros Read the Calendar
After reading this guide, you might ask: "So which economic indicator is the most important?"
It sounds reasonable. In reality, it's the wrong question.
Professional traders don't rank reports like sports fans rank players. They ask:
Which report has the greatest potential to change the market's current expectations?
A CPI report may dominate one month. The next month, employment matters more. Later, a banking scare may make a press conference more important than any inflation print. Importance depends on the story the market is currently trying to understand.
Why Good News Can Sometimes Crash the Market
The economy can look healthy — strong employment, solid spending, rising profits — and stocks can still fall if investors expect higher interest rates. Higher rates raise borrowing costs and reduce the present value of future earnings.
Conversely, slowing growth and weaker employment can trigger a rally if investors conclude the central bank can finally cut rates.
Every Report Answers One Big Question
Although inflation, employment, GDP, retail sales, PMI, and central bank meetings look different, they all contribute to answering:
What is the central bank likely to do next?
| Report | Question it helps answer |
|---|---|
| Inflation | Are prices becoming difficult to control? |
| Employment | Is the labor market still strong enough to support inflation? |
| Retail Sales | Are consumers continuing to spend? |
| PMI | Are businesses preparing for expansion or contraction? |
| GDP | How fast is the economy growing overall? |
How Professionals Prepare Before High-Impact Events
Preparation matters far more than speed. Before an important release, experienced traders typically know:
- What the market is expecting (the forecast)
- Why today's report matters in the current context
- Which markets are most sensitive today
- What result would genuinely surprise investors
- How they will respond if expectations are completely wrong
A Practical 5-Step Framework
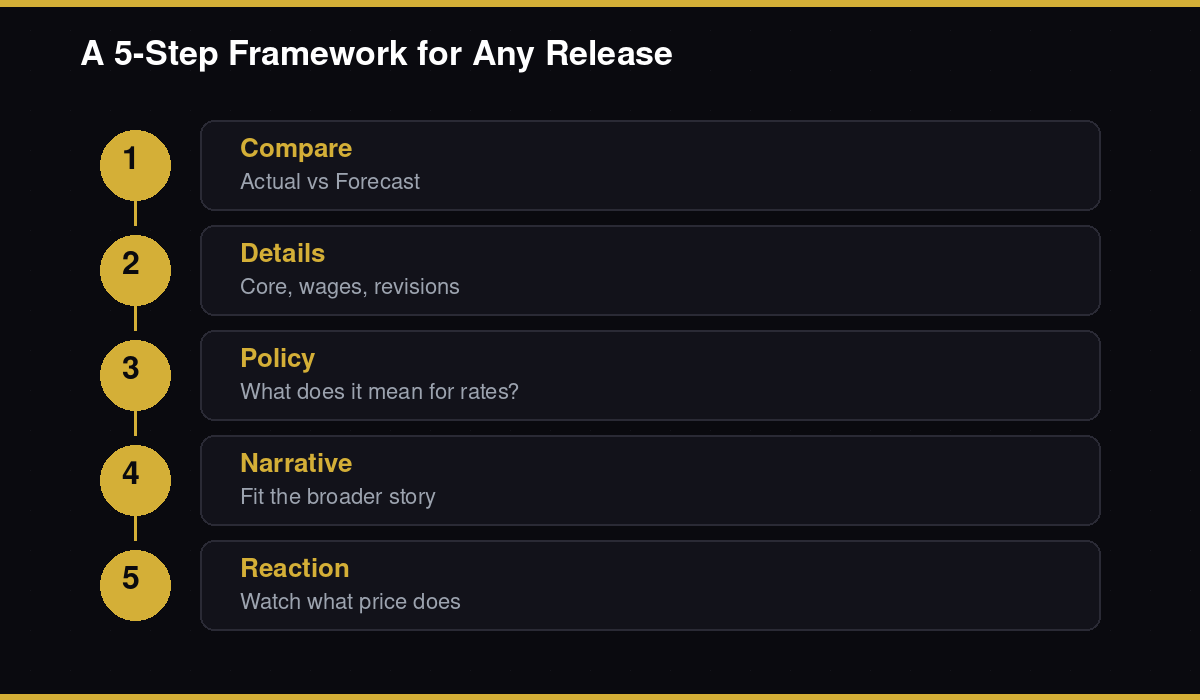
Compare Actual vs Forecast
This is where the first market reaction usually begins. A report matters relative to expectations.
Examine the details
CPI → Core. NFP → wages. GDP → consumption vs investment. Markets sometimes reverse after the details land.
Ask what this means for monetary policy
Does this increase or decrease the probability of future rate changes? If yes, moves may continue long after the print.
Confirm the broader narrative
Never rely on one report. One print can be noise. Several reports moving together tell a clearer story.
Observe the market's reaction
Sometimes a "bullish" report barely moves price. The reaction often reveals more than the data itself.
The Most Common Mistakes Traders Make
Trading every high-impact event
Not every event offers an attractive opportunity. Sometimes the best decision is to stay out.
Ignoring expectations
A "good" report may already be fully priced in. Without the consensus, traders misinterpret the news.
Looking at one indicator in isolation
Inflation influences rates. Rates influence currencies. Employment influences spending. Macro is a system.
Confusing volatility with opportunity
Large swings attract attention. They do not automatically create high-quality trades. Sometimes volatility is uncertainty, not conviction.
Forgetting risk management
No analysis is perfect. Geopolitics, policy shifts, and revisions can invalidate a thesis quickly. Risk comes first.
Building a Daily Economic Calendar Routine
- Morning: Review today's events, mark high-impact releases, read consensus forecasts, note central bank speakers
- Before the event: Reduce unnecessary exposure, prepare bullish and bearish scenarios, decide what would invalidate your idea
- After the release: Compare Actual vs Forecast, read beyond the headline, watch yields / FX / equities together, wait for volatility to stabilize
Want high-impact events inside your product — live?
Power widgets, alerts, and dashboards with EconPulse. Filter by date, currency, country, and importance, then render the same Actual / Forecast / Previous fields traders rely on — without maintaining scrapers.
The Economic Calendar Is More Than a Schedule
Many beginners treat the economic calendar as a list of dates. Professional investors see something entirely different.
Every event represents a new piece of information about the world's largest economies. Every report either strengthens or weakens an existing market narrative. Every central bank decision reflects months of accumulated economic evidence.
When viewed this way, the calendar stops being a timetable.
It becomes a map of the forces driving global capital.
Final Thoughts
Financial markets are often described as unpredictable. In the short term, they certainly can be. Yet over longer periods, markets consistently return to the same fundamental questions:
- Is inflation rising or falling?
- Is the economy growing or slowing?
- Are consumers spending?
- Are businesses investing?
- Will central banks tighten policy or begin easing?
Every high-impact economic event discussed in this guide helps answer one or more of these questions.
Successful trading is not about predicting every economic report correctly. It is about understanding why markets react, what information investors care about most, and how each new piece of data changes the bigger picture.
The economic calendar is where that process begins.
Master the framework, not the headlines
Once you begin thinking in terms of expectations, narratives, and monetary policy — instead of isolated headlines — you'll stop reacting to the news like the average trader. You'll start interpreting it the way professional macro investors do.
Related articles
Need an Economic Calendar API?
Power Forex dashboards and fintech apps with multilingual macro event data — NFP, CPI, rates, and more.
Get API Key